最近几年来,地理信息系统无论是在理论上还是应用上都处在一个飞速发展的阶段。 GIS被应用于多个领域的建模和决策支持,如城市管理、区划、环境整治等等,地理信息成为信息时代重要的组成部分之一; “数字地球”概念的提出,更进一步推动了作为其技术支撑的GIS的发展。 与此同时,一些学者致力于相关的理论研究,如空间感知、空间数据误差、空间关系的形式化等等。 这恰好说明了地理信息系统作为应用技术和学科的两个方面,并且这两个方面构成了相互促进的发展过程。
9.44.1. Brief introduction 
When we do an application, we may make all kinds of mistakes, which can lead to all kinds of mistakes. Therefore, in order to fix these errors or defects, we need to debug the application.
9.44.2. Select a debugger 
The debuggers in Xcode are GDB and LLDB debuggers, and GDB is the default. LLDB is a debugger that is part of LLVM’s open source compiler project. You can change debugging and edit activity plan options.
9.44.3. How do I find coding errors? 
We just need to build our application, the code is compiled by the compiler, and all messages, errors and warnings will be displayed as well as the cause of the error, and we can correct them. You can click product, and then click “analyze”, the problems that may occur in the application.
9.44.4. Set breakpoint 
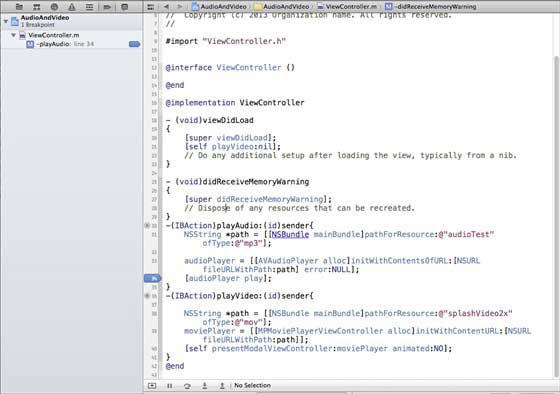
Breakpoints help us understand our application objects and help us identify many flaws, including the different states of logical problems. We just need to click on the line number to create a breakpoint. We can delete the breakpoint by clicking and dragging it. As shown below
When we run the application and select playVideo, the button’s application will be paused, and let’s analyze the state of our application. When the breakpoint is triggered, we will get an output, as shown in the following figure
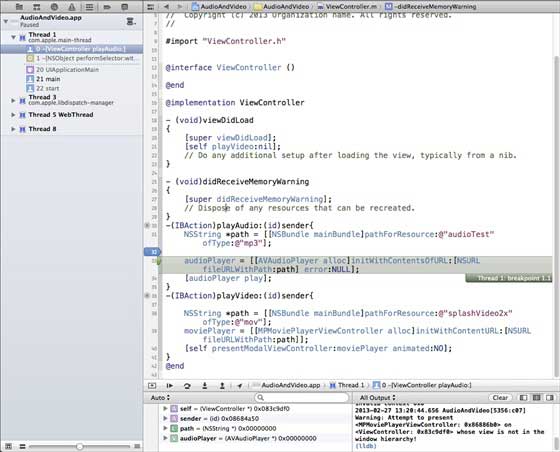
You can easily determine which thread triggered the breakpoint. You can see objects at the bottom, such as self,sender, etc., which hold the values of the corresponding objects, and we can expand some of these objects to see what their state is.
To continue the application, we select the continue button (the leftmost button) in the debug area, as shown in the following figure. Other options include steps and step skip

9.44.5. Abnormal breakpoint 
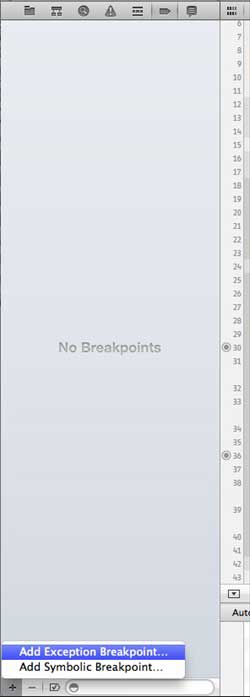
We also have exception breakpoints that trigger the location where the application stops where the exception occurs. We can create an exception breakpoint by selecting the “+” button after selecting debug navigation. You will get the following window
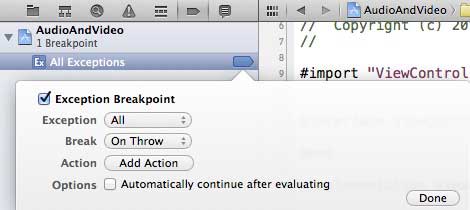
Then, we need to select the “Exception Breakpoint” breakpoint, which displays the following window
9.44.6. What’s the next step? 
You can do it in the Xcode 4 用户指南 Learn more about debugging and other Xcode features.